
Hammel is an R package for doing demographic microsimulation. Hammel is a spiritual successor to the venerable SOCSIM program but provides a modern interface, enhanced features, greater user customization, and faster computation. Hammel models demographic processes in continuous time and features:
- Stratification of rate schedules by time, group membership, union type, sex, and parity (for fertility).
- Union formation processes that including union dissolution, cohabitation and remarriage, and customizable rules for partner matching.
- Multiple user-defined group identifiers (e.g. race, education, region) complete with age or duration-specific transition rates, customizable partner matching rules across groups, customizable inheritance rules for newborns, and ancestry tracking.
- Helper functions to extract important details from simulations such as age-specific rates, population size, and kinship relations.
- Helper functions to build starting populations and to stratify rate schedules.
- A pipable interface for building and modifying simulation models.
Installation
Hammel is currently only available through GitHub. You can install the latest development version with pak or devtools:
# install.packages("pak")
pak::pak("AaronGullickson/hammel")

# install.packages("devtools")
devtools::install_github("AaronGullickson/hammel")
Example
Several detailed examples of Hammel simulations are available on the documentation website. Here I provide a simple toy example.
To use Hammel, you first set up a simulation model, which can be constructed using a pipable interface. The primary inputs for Hammel are tables of age-specific rate schedules.
data(usa_2000_mortality)
data(usa_2000_fertility)

model <- hammel_model() |>
  set_fertility(usa_2000_fertility) |>
  set_mortality(usa_2000_mortality) |>
  set_union_formation("on_demand")
All models must have fertility and mortality rates and some way to deal with union formation. Instead of supplying marriage rates, I am using an “on demand” model for union formation that partners off unpartnered women when they have a birth, but set_union_formation allows customization based on marriages rates, dissolution rates, and cohabitation.
Once I have the model, I can add a starting population and simulate. In many cases, you would “burn in” a simulation to get a stable population distribution for the starting population, but I won’t do that here.
pop_start <- generate_uniform_population(10000, end_time = 0)
model <- model |>
  set_population(pop_start)
pop_end <- run_simulation(model, 100, seed = 42)
summary(pop_end)
── Population ──
• First date: -69.993
• End time: 100
• Persons alive at end time: 11333
• Total births: 24736
• Total unrealized births: 0
• Total deaths: 13403
• Total unions: 6920
• Total dissolutions: 0
• Latest simulation run
• Time period: 0-100
• Starting population size: 10000
• Ending population size: 11333
── Living population by age and sex
Male Age Female
| 100-104 |
| 95-99 | ##
## | 90-94 | #####
##### | 85-89 | ########
######### | 80-84 | ############
############ | 75-79 | ###############
############### | 70-74 | #################
################# | 65-69 | ##################
################### | 60-64 | ###################
##################### | 55-59 | #####################
#################### | 50-54 | #######################
##################### | 45-49 | ####################
####################### | 40-44 | ######################
###################### | 35-39 | #######################
###################### | 30-34 | ######################
####################### | 25-29 | ######################
####################### | 20-24 | #######################
####################### | 15-19 | ########################
######################### | 10-14 | ########################
####################### | 5-9 | ######################
####################### | 0-4 | ####################### I can also compute summary statistics like population size over time.
calculate_population_size(pop_end, seq(0, 100, 5))# A tibble: 21 × 2
time population
<dbl> <int>
1 0 10000
2 5 10432
3 10 10804
4 15 11127
5 20 11259
6 25 11263
7 30 11200
8 35 11202
9 40 11213
10 45 11216
# ℹ 11 more rows
# ℹ Use `print(n = ...)` to see more rowsDedications
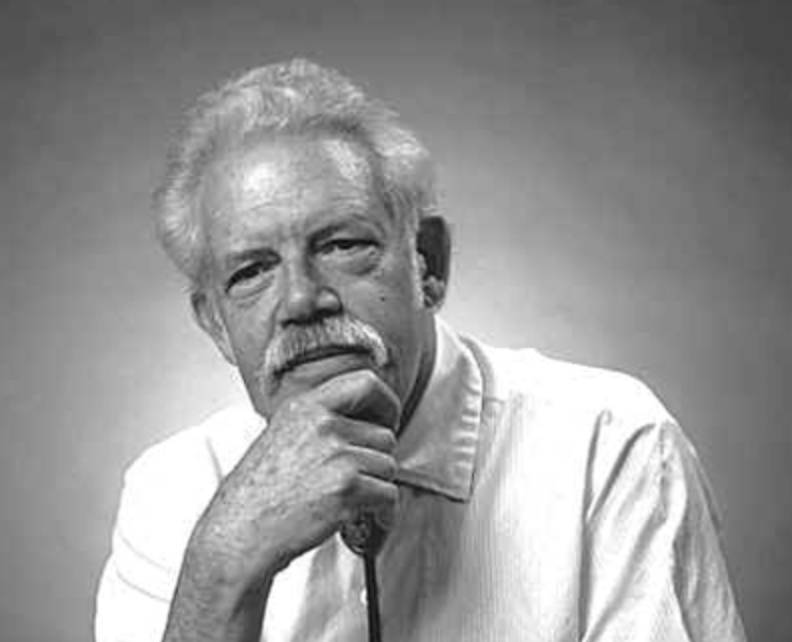
Hammel is named after Eugene A. Hammel, the late anthropologist who had a long career at the University of California, Berkeley. Among his many other accomplishments, Gene re-founded the UC Berkeley Demography Department and was responsible, along with Kenneth Wachter, for the development of the SOCSIM program.